


It's Monday, and there is no better place to start the week with the only asset that has mattered for the past 8 months - the Dollar. Although Friday's job report brought a spike in the Dollar Index, the down trend remains intact. However, the likelihood of the downtrend ending leading to a counter trend rally or consolidation is now as high as it has been in months.
Figure 1 is a weekly chart of the Dollar Index. This is the same chart I have been showing since June, 2009 - prior to the Dollar Index unraveling. Positive divergence bars are marked with pink markers inside the gray ovals. A weekly close over 75.94, which is the high of the most recent positive divergence bar, would suggest that the downtrend in the Dollar Index is ending.
Figure 1. Dollar Index/ weekly
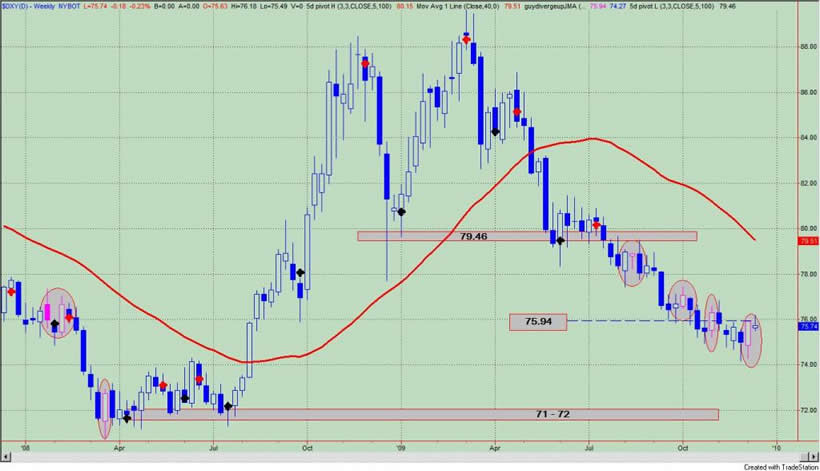
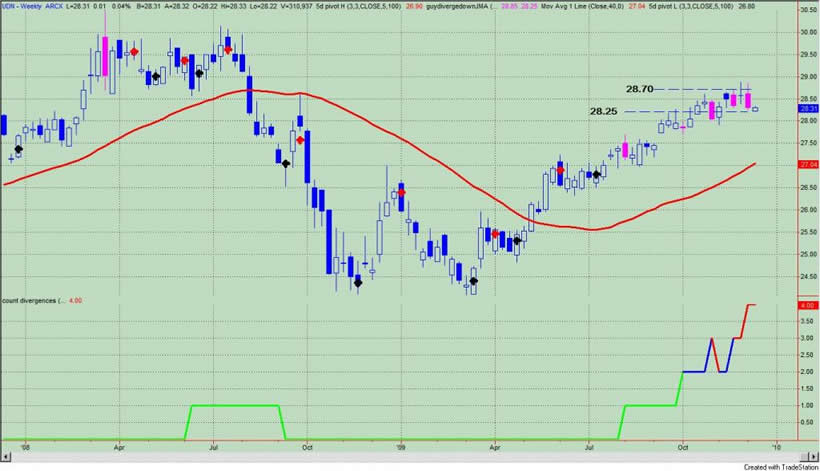
Figure 2 is a weekly chart of the PowerShares DB US Dollar Bear (symbol: UDN). This is the inverse of the Dollar Index. The indicator in the bottom panel searches for negative divergence bars, and we have had a cluster of these over the past 13 weeks. As discussed recently, this can be an ominous topping pattern or a spring board to higher prices - i.e., a blow off market top where prices really accelerate higher. A weekly close greater than 28.70 would suggest higher prices for UDN, which means a much lower Dollar Index. A weekly close below 28.25 and the down trend in the Dollar is over for now.
Figure 2. UDN/ weekly
My take is this: in all likelihood, this is the end of the down trend for the Dollar Index.
By Guy Lerner


![[Valid RSS]](valid-rss.png "Validate my RSS feed")
0 comments:
Post a Comment